Ms. Blanchet, my statistic teacher, have just give us back our Data Analysis Toolbox paper. On my paper, Ms. Blanchet told me I need to add interpretations, inferences, and graphs. So I made a lot of changes to my paper. My paper went from about half a page to more than a page. The first thing I did is that I put my data analysis toolbox in an outline form ins tead of paragraph form. I also include a section about how the information will be presented. I will give the five-number summary for my data. I will present my information with a histogram and a box plot. I will also include the mean, standard deviation, and outliers (if there is any) for my data. Also, a one-sample t test will be used to infer about the population of tourists. I decided to use a one-sample t test because I have no information on the population, and I have an unknown standard deviation. The t test gives me more variability than a z test, which is just what I needed. Also, at the end I included the question for my project. “How far is one willing to travel to downtown New Orleans?” This website http://home.ubalt.edu/ntsbarsh/stat-data/Topics.htm#rwsaq here really helps me with my data analysis toolbox. It gives me a lot of information about “What is Statistical Analysis?” So according to this website there is four steps for “studying a problem through the use of statistical data analysis. Step One is defining the problem. Step Two is collecting the data. Step Three is analyzing the data and Step Four is reporting the results. So with my data analysis toolbox I am basically finished with Step One and Step Three. I am currently working on Step Two. Hopefully, I will be done with Step Two soon.
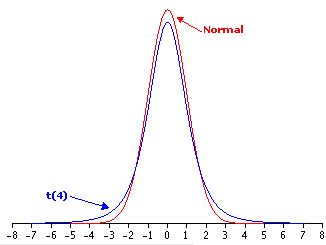 tead of paragraph form. I also include a section about how the information will be presented. I will give the five-number summary for my data. I will present my information with a histogram and a box plot. I will also include the mean, standard deviation, and outliers (if there is any) for my data. Also, a one-sample t test will be used to infer about the population of tourists. I decided to use a one-sample t test because I have no information on the population, and I have an unknown standard deviation. The t test gives me more variability than a z test, which is just what I needed. Also, at the end I included the question for my project. “How far is one willing to travel to downtown New Orleans?” This website http://home.ubalt.edu/ntsbarsh/stat-data/Topics.htm#rwsaq here really helps me with my data analysis toolbox. It gives me a lot of information about “What is Statistical Analysis?” So according to this website there is four steps for “studying a problem through the use of statistical data analysis. Step One is defining the problem. Step Two is collecting the data. Step Three is analyzing the data and Step Four is reporting the results. So with my data analysis toolbox I am basically finished with Step One and Step Three. I am currently working on Step Two. Hopefully, I will be done with Step Two soon.